Ever felt that strange hesitation when you floor the gas pedal? Or maybe your car feels sluggish after a modification, even though it should be faster. The problem isn't always mechanical. Often, it’s in the numbers. Without seeing what your engine is actually doing under load, you’re just guessing. Data logging is the process of recording real-time vehicle data from the engine control unit (ECU) and sensors to analyze performance. It turns guesswork into precision engineering. Whether you are building a track day machine or refining a daily driver, understanding these parameters is the difference between a safe tune and a blown head gasket.
The Core Parameters You Must Track
Not all data is created equal. When you connect your laptop or phone to the car, there are specific metrics that matter most for engine safety and power. Ignoring any of these can lead to catastrophic failure.
- Air-Fuel Ratio (AFR): This is the holy grail of tuning. You need this to be precise. A stoichiometric ratio for gasoline is 14.7:1. For maximum power, you usually aim for 12.5:1 to 13.0:1 under heavy load. If it goes above 14.0:1 under hard acceleration, you are running lean, which causes overheating and detonation. If it drops below 11.5:1, you are wasting fuel and fouling spark plugs.
- Engine Coolant Temperature (ECT): Keep an eye on this during long pulls. If your coolant spikes past 230°F (110°C), your efficiency drops, and you risk boiling over. Consistent temperatures tell you if your cooling system is up to the task of the new power levels.
- Ignition Timing: Measured in degrees before top dead center (BTDC). More timing generally means more power, but too much causes pre-ignition or knock. You want to see how the ECU adjusts timing based on load and speed.
- Manifold Absolute Pressure (MAP) or Mass Air Flow (MAF): These tell you how much air is entering the engine. Discrepancies here often point to vacuum leaks or faulty sensors rather than tuning issues.
- Throttle Position Sensor (TPS): Shows exactly how far you are pressing the pedal. Useful for calibrating throttle response maps.
Focusing on these five gives you a complete picture of combustion health. Anything else is secondary until these are stable.
Hardware Setup: Getting Reliable Data
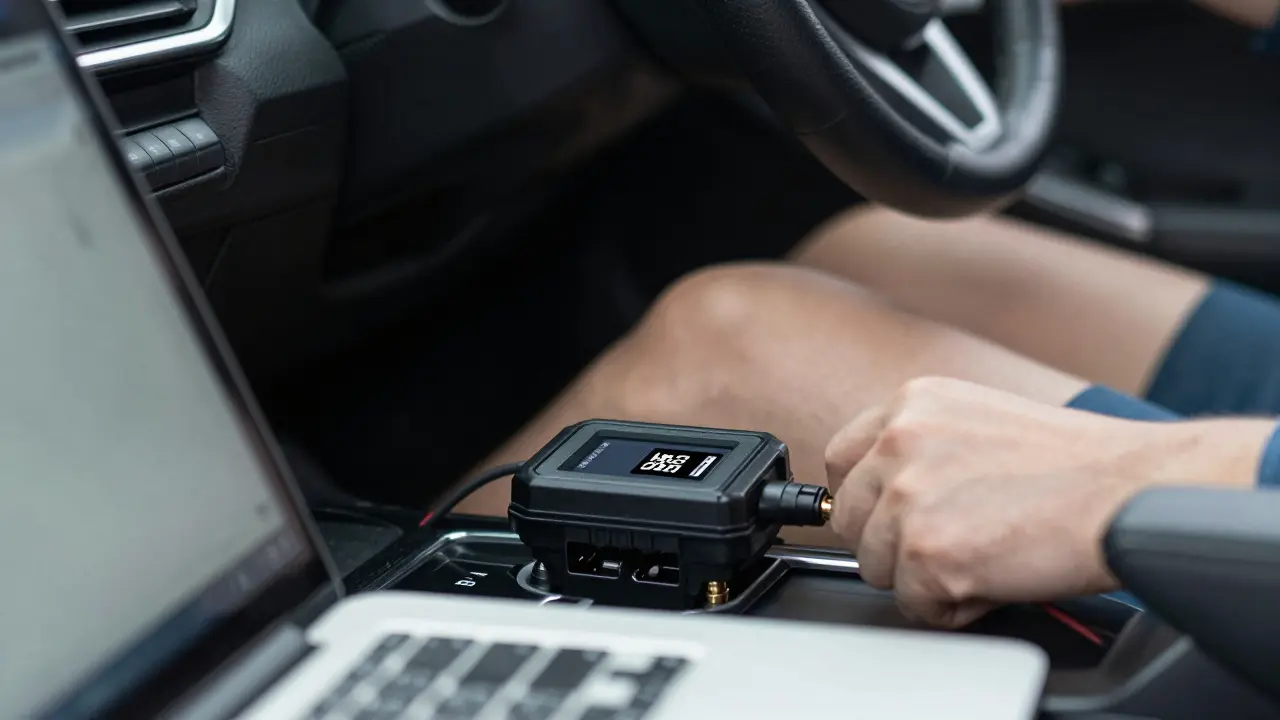
You cannot tune what you cannot measure accurately. The quality of your log depends entirely on your hardware chain. Start with the connection method. Most modern cars use the OBD-II port, located under the dashboard near the driver's knee, providing access to standard diagnostic protocols. Plug in a reliable interface device. Cheap Bluetooth dongles often drop packets at high sampling rates, leading to gaps in your data. Look for devices that support high-frequency polling, ideally 10Hz or higher for transient events like shifting.
Sensors are where many people cut corners. Factory oxygen sensors are narrow-band; they only tell you if the mixture is rich or lean, not by how much. For tuning, you absolutely need a Wideband Oxygen Sensor that provides precise air-fuel ratio readings across a broad range, typically from 10:1 to 20:1. Install this in the exhaust manifold as close to the cylinder head as possible. The further back you place it, the more the signal lags behind actual combustion events. A laggy sensor makes it impossible to catch rapid lean spikes that damage pistons.
Don't forget your Knock Sensor data. While many basic logs show a binary "knock detected" flag, advanced tuners look at the knock intensity percentage. This tells you how close the ECU is to pulling timing to save the engine. If you see constant knock activity, your octane rating is too low, or your timing is too aggressive.
Software Tools for Analysis
Once you have the data, you need software to visualize it. There are two main categories of tools: generic OBD readers and specialized tuning suites. Generic apps give you live gauges, which are fine for checking basics, but they lack the depth for analysis. For serious work, you need software that allows multi-axis graphing.
Popular options include HP Tuners VCM Suite, used for GM vehicles, offering deep ECU access and customizable data plotting. Another common choice is EFILive, which serves Ford engines with extensive calibration editing capabilities. For universal applications, MotivPower works well with many brands via CAN bus protocols, providing flexible graph layouts. Regardless of the brand, ensure the software lets you overlay multiple parameters on one graph. Seeing AFR drop while MAP rises helps you identify exactly when the engine runs lean.
Set your sampling rate correctly. For steady-state cruising, 1Hz is enough. But for launch control or shift points, set it to 10Hz or 20Hz. Lower rates miss the critical milliseconds where detonation happens. Higher rates create massive files, so balance detail with storage space.
How to Log Correctly: Step-by-Step
Bad data leads to bad decisions. Follow this routine to ensure your logs are usable.
- Clear Fault Codes: Before every session, clear any stored trouble codes. Old errors can skew sensor readings or trigger limp modes unexpectedly.
- Warm Up the Engine: Cold engines run richer and behave differently. Let the car reach normal operating temperature before logging. Note the ambient temperature and humidity, as dense air changes airflow calculations.
- Select the Right Map: If your ECU has multiple tunes (like a street map and a race map), make sure you know which one is active. Logging on the wrong map confuses the analysis.
- Drive Consistently: Perform the same maneuver twice. One time lightly, one time aggressively. Compare the two logs. Look for differences in how the ECU reacts to load changes.
- Log Specific Events: Don’t just record a whole drive. Focus on specific scenarios: hard acceleration from 2nd gear, sustained highway passing, or idle stability after shutdown.
- Check for Dropouts: After the run, review the file immediately. If there are black gaps in the graph, your connection was unstable. Redo the test.
This disciplined approach ensures that when you find an issue, it’s real and repeatable, not a glitch.
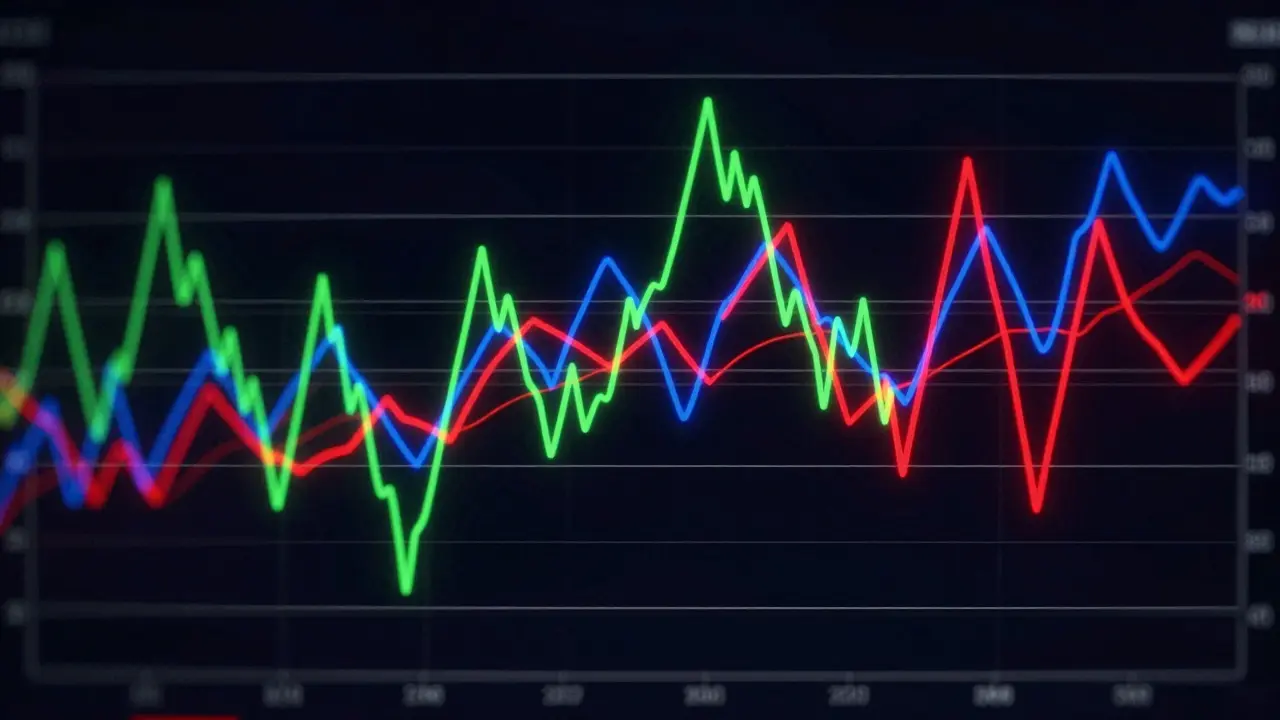
Interpreting the Results
Looking at a wall of lines can be overwhelming. Start by isolating the variables. Pick one parameter to focus on, usually AFR. Draw horizontal lines on your graph at 12.5 and 14.0. Any part of the line that crosses into the red zone (above 14.0) under high load is dangerous. Check the corresponding RPM and Load axes to see exactly where this happens. Is it at 3,000 RPM in 2nd gear? That’s your target area for adjustment.
Next, look at timing pull. If the ignition timing drops suddenly by 5-10 degrees, the ECU detected knock. Correlate this with your AFR. If the mixture was perfect but timing pulled, you might need higher octane fuel or cooler intake charges. If the mixture was lean, enrichen that cell in the fuel map.
Pay attention to Long-Term Fuel Trim (LTFT) and Short-Term Fuel Trim (STFT). These values show how much the ECU is trying to compensate for your base map. If LTFT is +10%, the engine is consistently adding fuel because the base map is too lean. If it’s -10%, it’s cutting fuel because the map is too rich. Ideally, you want these trims close to 0% at steady state, meaning your base fuel map is accurate.
| Issue | Probable Cause | Solution |
|---|---|---|
| AFR Spikes Erratically | Faulty Wideband Sensor or Wiring | Check heater circuit voltage; replace sensor if inconsistent |
| Missing Data Points | Weak OBD Connection or High Sampling Rate | Use wired connection instead of Bluetooth; lower sample rate |
| Timing Pulls Constantly | Knock Detected or Lean Condition | Verify fuel pressure; switch to premium fuel; reduce base timing |
| Coolant Temp Rising Fast | Inadequate Cooling or Rich Mixture | Inspect radiator fan; check for parasitic heat loss |
Safety First: Avoiding Common Mistakes
Data logging is powerful, but it can give you a false sense of security. Just because the numbers look good doesn’t mean the engine is healthy. Always listen to the car. A subtle ping or rattle might indicate mechanical issues that sensors miss.
Never log on public roads without extreme caution. Focusing on screens distracts you from traffic. Use a closed course or a quiet industrial park for hard launches. Also, never assume a single log is definitive. Engines vary slightly due to manufacturing tolerances. What works on one car might stress another. Always monitor oil pressure and temperature alongside engine parameters. Low oil pressure under high boost can destroy bearings before you even see a knock warning.
Finally, don’t ignore the limits of your hardware. Stock intercoolers might not handle the increased airflow from a tuned engine, leading to heat soak. Your data might show perfect AFRs initially, but after ten minutes of driving, the intake air temperature (IAT) rises, causing the mixture to effectively become leaner due to density changes. Log IAT trends over time to catch this thermal degradation.
What is the best way to log data for engine tuning?
The best method involves using a wired OBD-II interface connected to dedicated tuning software like HP Tuners or EFILive. Set the sampling rate to 10Hz for dynamic events. Ensure you have a wideband oxygen sensor installed for accurate air-fuel ratio readings. Always warm up the engine and clear fault codes before starting the log.
Why is my data logger dropping frames?
Frame drops usually occur due to wireless interference or excessive sampling rates. Bluetooth connections are prone to latency. Switch to a USB-wired connection. Also, try lowering the sampling rate from 20Hz to 10Hz if your device struggles to keep up with the data volume.
Can I use a cheap Bluetooth OBD scanner for tuning?
No, cheap Bluetooth scanners are not suitable for tuning. They often lack the processing power to handle high-frequency data streams and may miss critical transient events like knock or lean spikes. They are fine for reading error codes but unreliable for performance analysis.
What does a high short-term fuel trim mean?
High positive short-term fuel trim (e.g., +10%) means the ECU is adding extra fuel because the current mixture is too lean. This indicates your base fuel map needs enrichment. Negative trim means the mixture is too rich, and the ECU is cutting fuel.
How do I interpret ignition timing pull?
When ignition timing drops significantly (retards), the ECU is protecting the engine from knock or pre-ignition. Check your air-fuel ratio first. If it’s lean, enrich the fuel. If it’s correct, you may need higher octane fuel or to reduce the base timing advance in that specific load/RPM cell.